Detecting Extreme Events in Lévy processes
In our paper we develop a length scale that we call the "bifurcation length". Below is a plot of this in the natural units of a Levy process, where is the width parameter, is the stability index, and is the evolution time.
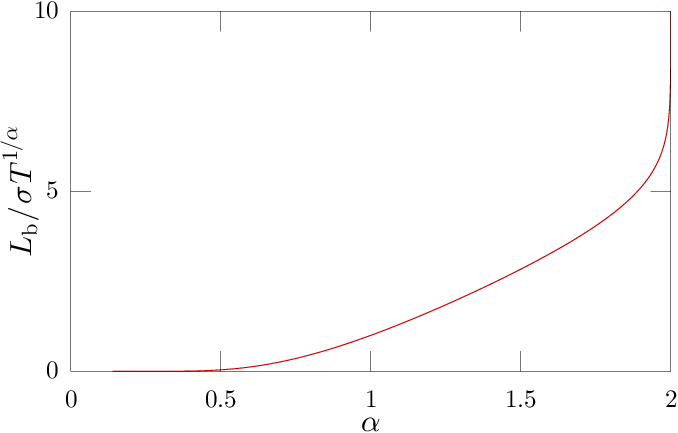
Notice that diverges as , demonstrating that this is indeed a scale that is distinct from the natural length scale.
To see the effectiveness of this scale for detecting extreme events, below I show a plot of a Levy process sample path ( with ) with certain "extreme" steps highlighted. You can highlight steps based on the bifurcation-length criteria () or a more naive criteria () by hovering your mouse over the corresponding indicator.
- No Highlights
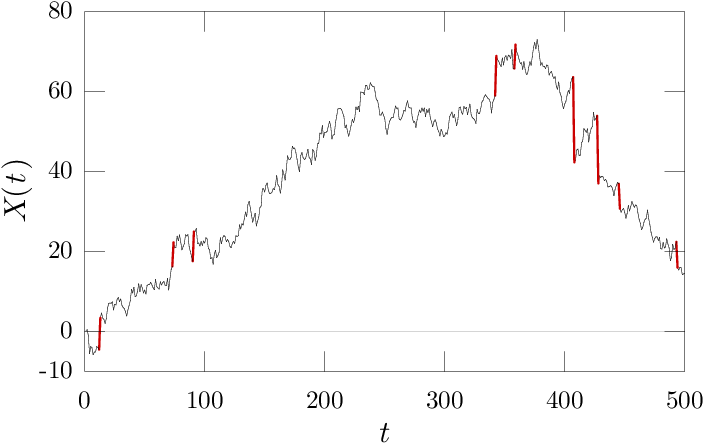
Qualitatively, we see that steps that appear "extreme" are well indicated by the bifurcation-length based criteria, while the naive criteria selects many steps that do not appear to be extreme by eye.
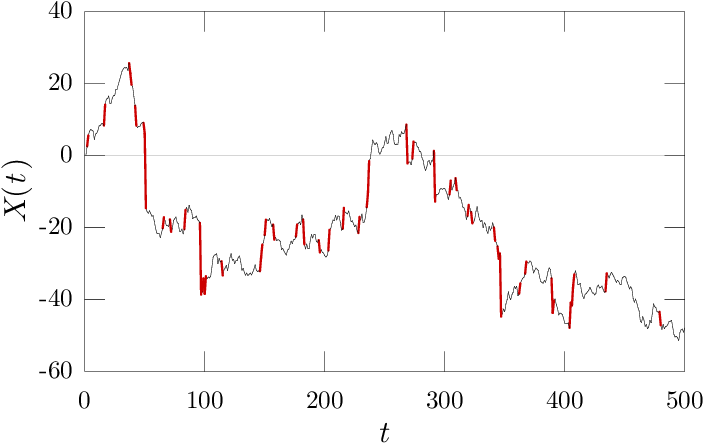
This also work for other values of , ( shown below), though as approaches both the bifurcation-length based criteria and the naive criteria indicate the same steps as "extreme".
- No Highlights
For the derivation and justification of this scale, see our paper here.